Nautical Chart Types Explained (Illustrated Guide)
Looking for a clear overview of the different nautical chart types? You’re in the right place. I couldn’t find a good resource online, so I thought I write it myself.
What are the different types of nautical charts?
- Navigation charts - contains detailed information about the world's waterways and oceans
- Pilot charts - weather routes and time voyages
- Small scale charts - general charts, also called Planning charts
- Large scale charts - coastal or general approach
- Harbor charts - largest scale charts that contain all information
There are a lot of minor differences between the chart types. The good news is we can sort this out for you. This guide will explain all different nautical chart types in detail. And we will discuss why you shouldn't trust all charts - not all charts are created equally.
What Are the Types of Charts?
Mostly when sailors talk about "charts", they are referring to Navigation charts. These are analogous to maps on land, in that they convey detailed information about the world’s waterways and oceans with detailed information on depths, bottom features, aids to navigation, landmarks and features, and any other information that helps safe navigation.
Outside of navigation charts, a few other useful types of charts are available to help sailors with route and passage planning.
Navigation charts
"Nautical Charts" most often refers to navigation charts. Maps of the oceans and waterways, if you will.
A direct comparison from a road map to a nautical chart isn't a good one since boats don't use roads. Road maps show routes, street names and some features but your navigation options are limited to roads, not going cross-country. They focus little on the topography of the land, so hills, mountains and valleys may not be obvious.
A marine chart is closer to a topographic map which shows the contour of the land and the shapes and sizes of hills, valleys and geographic features. A nautical chart shows depths, ridges, islands, shallows and similar features. This information is useful to the sailor who is always doing "off-road" navigation and needs to know about the layout under the surface.
Unlike road maps, charts will contain extensive detail about aids to navigation - the various buoys, daymarks, lighthouses and other permanent fixtures to help you find your position and mark dangerous waters.
Navigation charts are available in paper and electronic formats, something we'll explore in more detail.
Pilot Charts
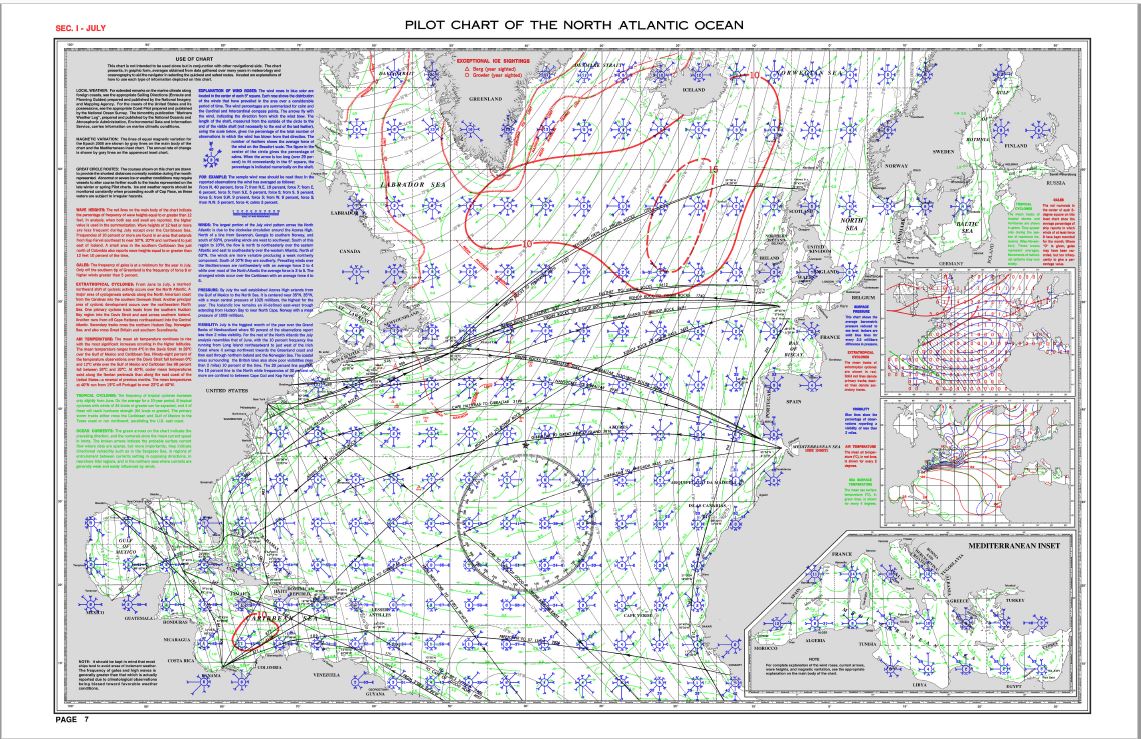
For sailors planning long voyages over oceans and large stretches of water, Pilot Charts are a valuable tool to pick weather routes and time voyages.
Compiled from hundreds of years of weather data collected by voyagers since the early days of sail, Pilot Charts contain rough predictions of prevailing conditions on the world's oceans for every month of the year. They allow planners to know the wind, current and weather they might expect, but they predict larger trends and historical probabilities rather precise detailed forecasts.
Chart Scale
All charts have baseline information that helps you interpret what the chart covers. This includes keys for depth, such as "soundings in feet" or "soundings in meters." But the most critical thing to know about any chart is its "Scale."
A chart's scale is expressed as a ratio, such as 1:2500 or 1:1,000,000. This refers to the ratio physical distance on the chart to physical distance in the real world. On a chart with a 1:25,000 scale, one inch on the paper chart equals 25,000 inches in the real world. One millimeter on the same chart represents 25,000 millimeters. It doesn't matter how you measure, the ratio from chart to real world is the same.
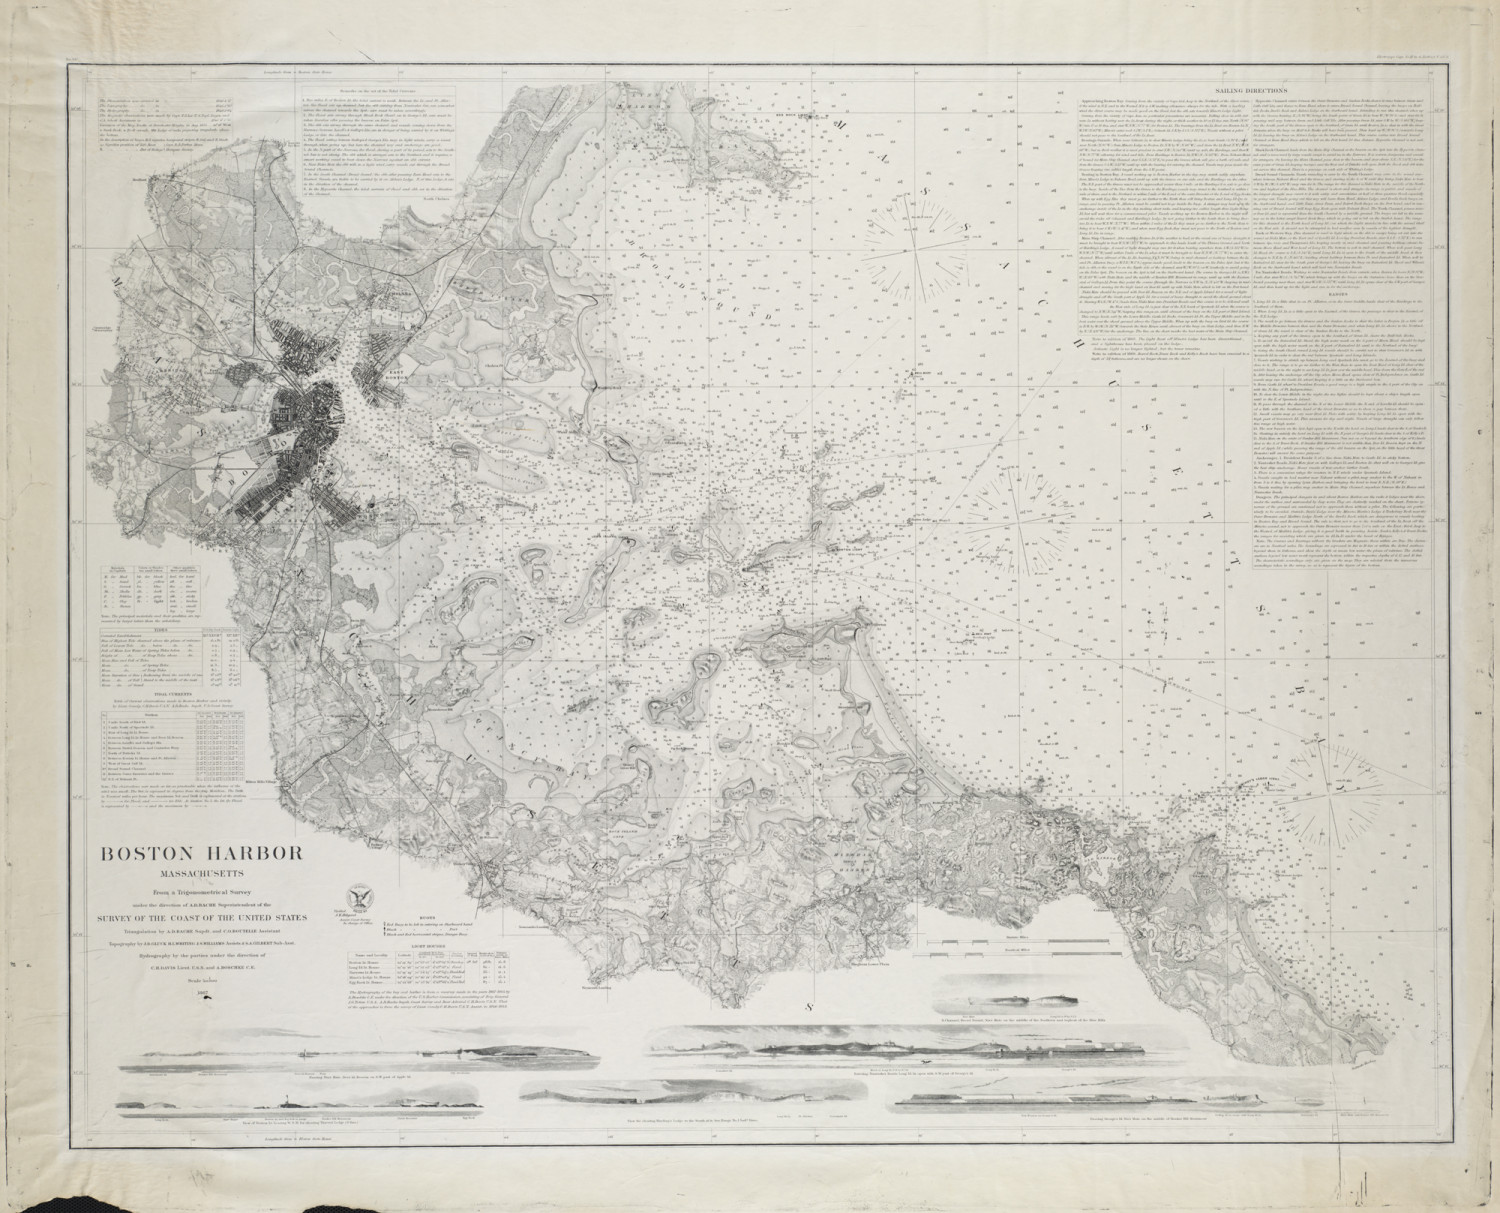
Small Scale Charts
Small scale navigation charts, often called General Charts, Sailing Charts, or Planning Charts offer the lowest detail but cover the largest geographic area. These charts often have a scale from 1:500,000 up to 1:5,000,000 for general charts and 1:100,000 to 1:500,000 for sailing charts. Small scale charts:
- Have less detail and have more scale error.
- Usually used for planning offshore passages and longer trips
- May not show all government marks or hazards
- May blank our areas of details that are shown on larger scale charts
- Are not suitable for planning harbor approaches or trips near land
- Broad surveys are not updated as often because of the size of the area covered.
Error Range: The positional error range of objects you see on the paper on the screen can run from 450 feet (150m) up to almost a mile (1,500m) on the smallest scale charts.
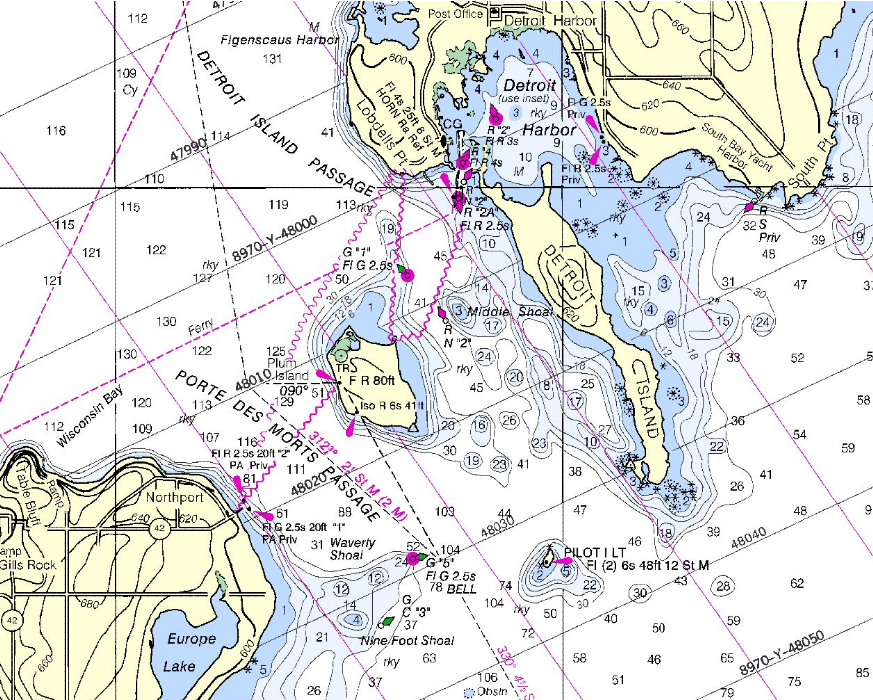
Large Scale Charts
Coastal and Approach charts are the ones of interest to most coastal sailors. With more detail and higher resolution, they will cover most of the local hazards. Scale ranges 1:25,000 up to 1:100,000.
These are the charts you will use to plan most trips under a day or so that don't head far out of sight of land.
- More detail than small scale charts, but still may omit some marks and features to maintain readability and reduce clutter.
- Use for coastal trip planning or the last legs of a long passage
- Often provided in coastal chart kits.
- More frequently resurveyed with frequent updates in Notice to Mariners.
Error Range: Scale error can range from about 25 feet up (7.5m) to 100 feet (30m) for the 100,000:1 charts.
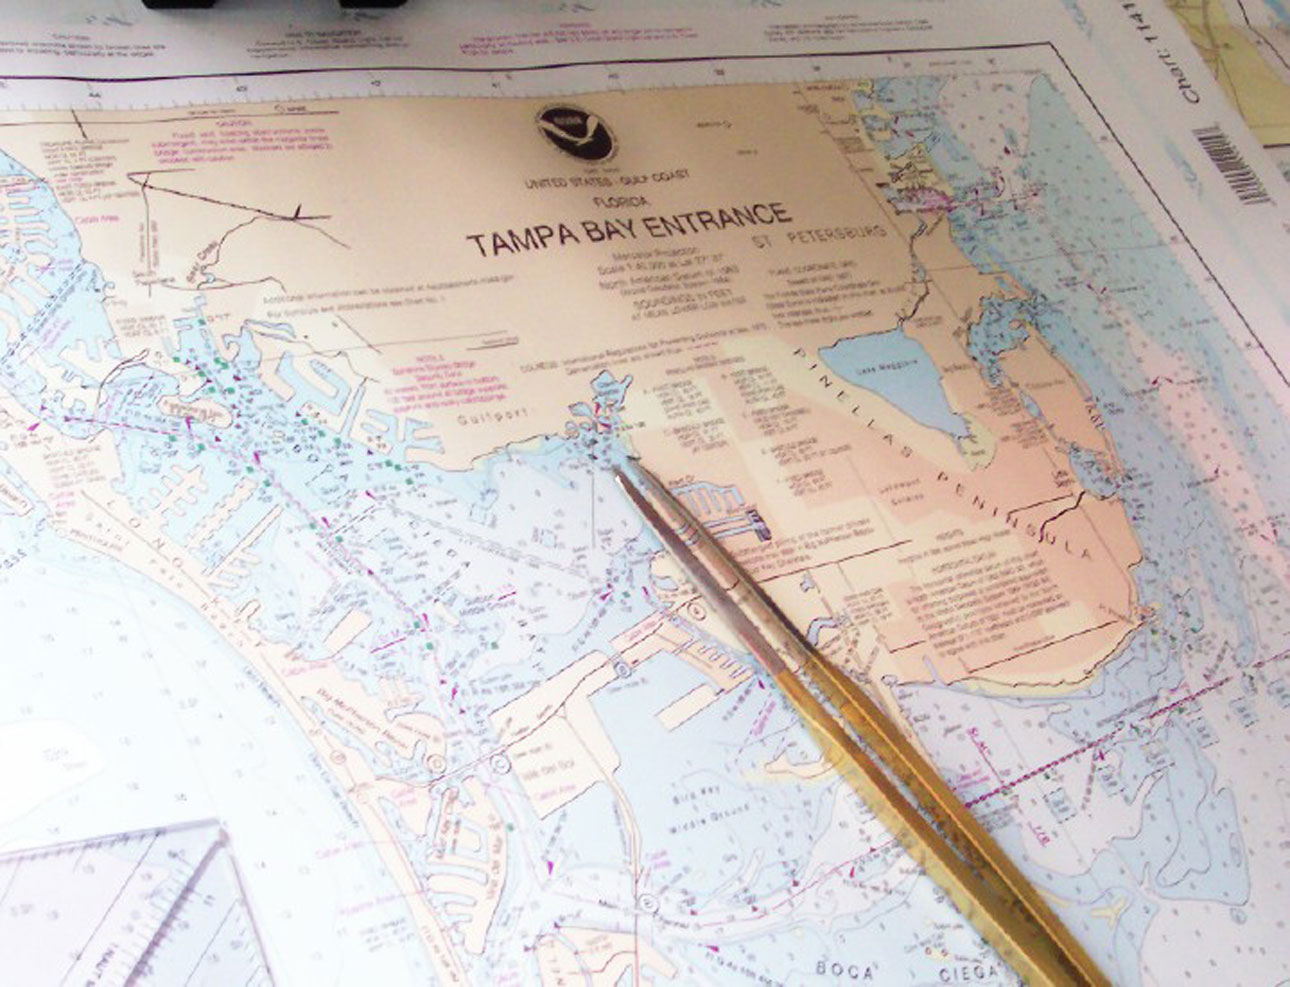
Harbor Charts
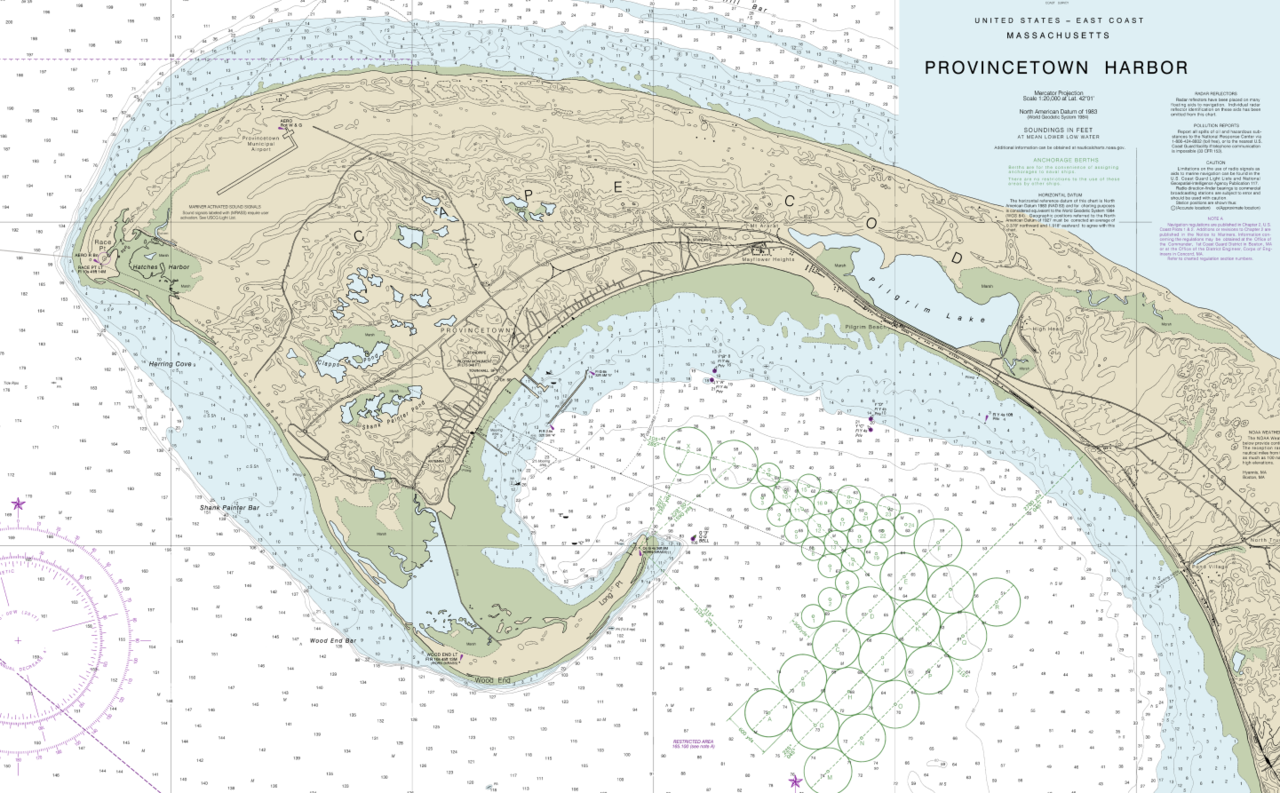
The largest scale charts show the most detail and should not leave any detail off the charts. Harbor charts and berth charts are used to get you from the harbor approach to your final destination. With scales ranging from 25,000:1 up to 5:000:1 or greater.
- Full detail with all known features, hazards and marks shown.
- Used for final approach and navigation in a harbor
- In chart kits, these are often inset in larger charts or on pages with smaller cutouts of harbor charts.
- The most accurate and often the most recently surveyed and updated in the Notice to Mariners.
Error Range: Confidence in location runs from twenty-five (7.5m) feet down to about five feet (1.5m).
Scale and Error
The scale of a chart also shows the amount of acceptable error in position for items placed on the chart. While the calculation is outside this document’s scope, you should know all charts have an error factor with exact positioning. GPS navigation has highlighted this error factor, as items charted before the GPS era may not show exactly where they are to the foot.
Drawing a line on a paper chart with a sharp mechanical pencil makes a line about .5 mm wide. The most accurate positioning on a printed page is about .3mm, and a pixel on a plotter or computer is .2mm wide. On a 1:1,000,000 scale general chart, that thin pencil line is covering a strip of water 500 meters wide! Even on a 1:5,000 harbor chart, a pixel can cover a spot a meter across.
Between the limits of space, technology, and human perception there will always be a small error, but it is lower at large scale charts.
TIP: "How long is a mile" is always on the charts and easy to find, since one degree latitude is always 60 nautical miles, and a minute of latitude is one mile. So the measurement for a mile is always on the side of the chart.
Paper Charts
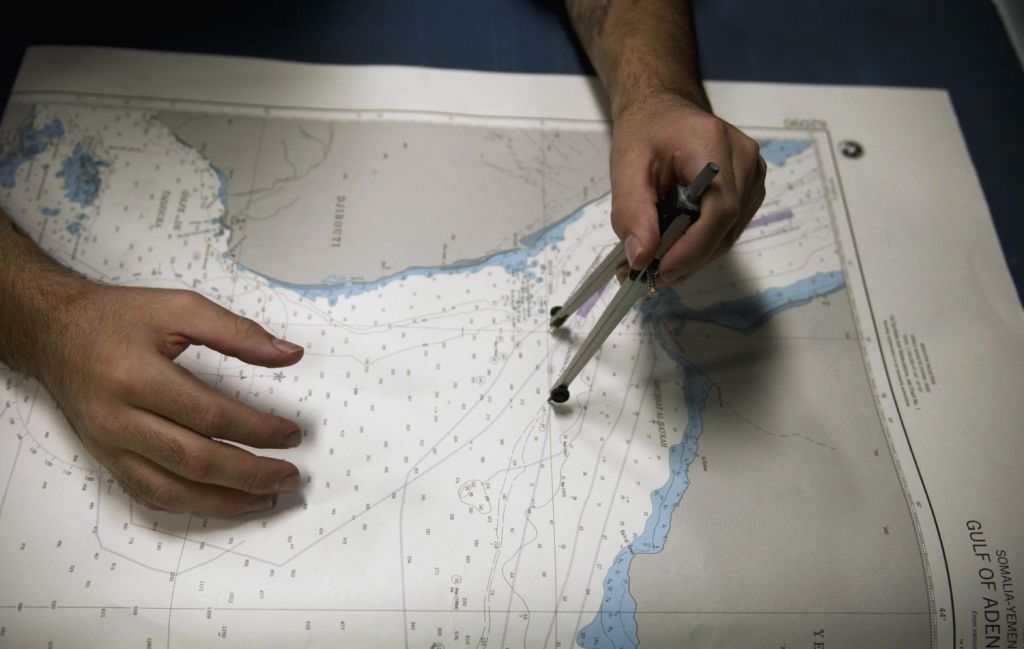
Older sailors learned to navigate with paper charts, and they're still the go-to for backing up electronic systems. Many still carry them, because they will still work even if you lose all the instruments and electronic aids. On our boat we've found some paper charts still give a better sense of the space we're planning to sail since they are larger than a computer screen and give you perspective.
I'm old enough to think everyone should know how to use dividers and a parallel rule to plot your course on a paper chart, but most sailors these days aren't using them regularly.
If you don't know how to read charts and plot your course, I recommend learning to do so. It isn't terribly difficult and reading my detailed guide on nautical chart navigation is a great starting point.
Availability
Paper charts can be awkward to store and have always been expensive to buy. The popularity of electronic chart plotting has made paper charts harder to find and even more expensive. You can get some of them at chandleries and specialty marine stores, but they are not as common as they used to be.
The U.S. Government recently stopped printing charts for sale, and the U.K. hasn't printed them on paper for some time. However, high resolution electronic files are available of many charts which can be printed and most can be ordered to print on demand.
Chart Kits
Chart Kits are a convenient means to get the large and small scale charts for a region without investing a fortune in individual paper charts. They aren't available for all parts of the world, but significant portions of American coastal waters and the Caribbean are available.
Some chart kits may include extra features such as pre-defined navigational waypoints and cruising guide information, or be made out of waterproof paper. They are large and expensive, but have many advantages of buying all individual paper charts of areas you cruise frequently.
Electronic Charts
Electronic charts allow for easier navigation with plotters on dedicated devices, phones, tablets and computers. In many cases they must be purchased and/or downloaded for specific devices, though many vendors do not charge for U.S. NOAA charts since they are available for free.
Electronic charts come in two styles - Raster and Vector. They appear quite different but do provide the same data. Which you prefer is up to you and what you're used to, but neither is intrinsically better. In some parts of the world, both formats may still not be available.
Raster
Raster charts look and behave exactly like paper charts and are base on stored images of paper charts. Many prefer the look of raster charts, as they are more attractive and often easier to read, especially if you learned navigation with paper charts.
Most electronic displays will perform quilting of Raster charts. This technique allows charts with different resolutions to move and overlap continuously to give a smooth scrolling of charts as a boat moves through an area or a user zooms in and out on the display.
Disadvantages are that they can not be easily configured to show custom data, and they have significantly larger file sizes.
Vector
Instead of storing charts as images, Vector charts store chart data in digital format in a database. The chart plotter interprets this data to display a visual representation of a chart. This is a newer chart format and is gaining popularity.
Because the charts are stored as data and interpreted, the displayed data can be heavily customized as the chart plot charter or software permits.
Vector charts allow the display of different depth units (feet, meters, etc.) and customize depth shading preferences. You may filter and show fewer elements, for example, suppressing the display of bottom type data to reduce screen clutter while sailing.
On the downside, the vector displays are often less visually appealing, and can become cluttered at different zoom levels if too much data is displayed.
It is important to note that though Vector charts are a newer format, they do not have newer underlying data. Vector charts to date have been made from a human review of raster (paper) charts which has been transcribed into a vector database. So a vector chart will be no more accurate than a raster chart, and may even have human induced errors from the transcription process.
Cautions with Electronic Charts
Electronic charting is a wonder that has made navigation more accessible for many people, giving greater access to the waters and oceans for more sailors. But they are not without problems.
Overzooming
Chart display software lets you zoom in and out easily, but many plotters allow you to zoom a chart past the scale of the chart once you've reached the largest scale chart you have installed. This is overzooming, and may cause navigation errors.
Recall the error level of a chart decreases as the scale gets larger. Once you zoom past the scale of the chart, you may see features on the screen which look more precisely plotted than they really are because of the error range of the chart. It is possible to plot courses which are not as safe as the chart implies by how it looks on the screen, so take care and leave a margin for error.
Some software will let you know when you've overzoomed, and some will not allow you to zoom in closer than the acceptable zoom level.
Careless Plotting
One thing old school paper chart plotting forces you to do is review your course in exacting detail as you draw lines with your parallel rules. You scour the charts at the right scale because you have no choice.
Electronic navigation lets you snap in a quick course on a small scale chart, so you can easily miss details when you plot. Take care to review the entire course on a zoomed-in level of detail before you sail it so you don't overlook any missing details or objects which appear to move at different levels of scale because of imprecise charting.
Chart Sources
Most charts are produced by government hydrography office, such as the National Oceanic and Atmospheric Administration in the United States, and the Admiralty charts made by the U.K. Hydrographic office. Both of these agencies also publish chart companions like the Coast Pilot series from NOAA or the Admiralty Sailing Directions from the U.K.
Electronic charts can also be purchased from commercial chart vendors, and may need to be specific to your chart plotter or plotting software.
Chart Updates
All charts are subject to updates from Notices to Mariners as corrections are found and features change. Charts with old data may not reflect newly dredged or old silted-in channels, new marks and aids, missing marks, newly discovered underwater topography and a whole host of other data.
Updating paper charts can be a hassle, as you must get a "Notice to Mariners" and hand mark the updates yourself. Most sailors don't end up doing this. Electronic charts will have period updates, including all the new Notices since the last publication. Before you take off on a trip away from land and easy internet access, double-check that your charts are all up to date.
Limitations of Charts
It is important to remember there are two driving reasons that governments spend millions of dollars producing and maintaining charts: commerce and national security. Recreational boat usage is not a top priority, but we benefit anyway.
What does this mean for the recreational boater? Mostly, that you must know areas that are neither commercially nor strategically important will not be prioritized for hydrographic surveys. Shipping lanes and harbors will get top priority. Backwaters and off-the-beaten-path gunkholes may only have a few soundings or very old data.
Some parts of the world like the South Pacific haven't been re-surveyed in a hundred years or more. Charts from these places can have a lot of error in them, and caution must always be taken when traveling in less traveled waters with little commercial or military traffic.
No chart is perfect, so always use all your senses when navigating. Including common sense. Remember - if your eyes and instruments don't agree with the chart, your eyes may be what is right. So take caution and don't just assume the chart is correct.
Master Chart Navigation with One Course
When you're ready to master chart navigation, I recommend you check out the Coastal Navigation course at our partner NauticEd. It is quite excellent. They cover chart navigation in-depth and will guide you through multiple quality exercises to make sure you really practice your new skills. It is really affordable as well.
You'll leave Coastal Navigation Clinic with an understanding of:
- The Charts and how to use navigation tools
- True north and magnetic north - and variation and deviation
- Determining your position using various techniques such as dead reckoning, running fixes and triangulation
- What to do with your GPS position to get you to your destination
- Set and drift from wind, tides and current
- How to simply determine your heading based on Set and Drift
Check out NauticEd's Navigation Clinic now.
Did you find the answer to your specific question?
👍 23 👎 5
Comments
Wayne Stuart Besso
Newly getting into sailing at retirement in Ontario, Canada and thank you for the free navigation info which I will eventually use for sailing. Thank you.
Jeannine Plath
You rocked this subject and have astounding insights. I also work hard in putting together great content about Airport Transfer, feel free to visit <a href=”https://treespk.com/bitrix/rk.php?goto=http://qh3.de/flyingstar/flughafentransfer-frankfurt-gross-gerau">QH3</a>
Leave a comment