Ultimate Guide to Nautical Chart Navigation (Plotting, Reading)
Whether you're on your dream vacation, heading out for a short weekend, or dreaming over the winter, you'll be looking at charts. Large-scale charts, small scale charts, harbor charts - what are all those symbols and how do you use them to find your way in the world?
How to read a chart, plot a course and navigate?
- In order to read a chart, you interpret longitude and latitude lines to determine your coordinates, which is your position.
- You have to understand and interpret different symbols like depth, scale, and navigation marks.
- Using these symbols, you find a safe course and plot it on the chart.
- Find the direction of this course using a compass.
- Maintain direction using the compass readings.
If you're new to navigation this can overwhelm, especially if you're looking at a crowded electronic vector chart. This guide gives you all the basics on how to read a chart and use it to plot a safe course from where you are to where you want to go.
On this page:
Navigation Basics
A nautical chart is like a road map. It shows you the expected lay of the land and gives references for finding your way to somewhere when don't know the path.
On land you've got roads, which limit where you can drive and how much trouble you can get into. If you're on Interstate 95 and you know the next exit number, you're good for figuring out where you are and how to get where you're going. No one will put a big rock in the middle of the highway that you won't see until you hit it.
But one patch of water looks a lot like another. When you can see land it's easier to figure where you are. If you get fog or it's night time or you're far out to sea, you have nothing to make one patch of blue look any different from another. And even if you can see landmarks, they won't help you if you can't identify them. And the water may cover hazards like rocks and shoals that you need to avoid. Eyeballing a lighthouse on land won't help you miss a shoal unless you know where the shoal is relative to your boat.
A nautical chart shows things under water and describes the landmarks and references you can see. Navigation is traveling a planned course from start to finish, using the chart to avoid obstacles and hazards. To understand how to do this, you need to understand how we refer to places in the world.
Geographic Coordinates
Centuries ago cartographers devised Geographic Coordinate system to locate any place on the world. Lines of latitude range from 0° at the equator to 90° at the poles and run parallel to the equator. Lines of longitude run from the north to the south start at 0° in Greenwich, England and run to 180° West and East.
We express Geographic Coordinates as Degrees/Minutes/Seconds (e.g. 35°43"25'), or with a decimal instead of Seconds (e.g. 35°43.424). There will also be a letter at the end to designate the hemisphere. They are always in pairs, with latitude followed by longitude.
An example of a complete coordinate is:
41° 39' 48" N
071° 26' 44" W
This will be a little over 41° North of the equator, and a little more than 071° West of Greenwich, England. If a longitude is only two digits (like the example), add a zero to the front of it to avoid confusion.
With a road map, I can give you directions to that place by saying "From Post Road, take a left on King Street, then another left on Water street." But coming by water those directions are useless. Coordinates tell you where something is, then you can find it with your charts.
How to recognize latitude lines
Latitude lines will be North or South of the equator and are always parallel to each other. One minute of latitude is equal to one Nautical Mile. So every degree of latitude is always 60 nautical miles from the next. If you have two latitude positions, you can estimate how far apart they are in a north/south direction.
We'll find this very convenient later on when we're measuring distances and plotting courses.
How to recognize longitude lines
We designate lines of longitude West or East, relative to Greenwich England. For example 071° West is a line running roughly through Cape Cod on the U.S. East Coast. But 071° East is near Kabul, Afghanistan.
Because they run from the North Pole to the South Pole, lines of longitude are not always the same distance apart. Picture slicing an orange into sections - two straight cuts from the "poles" on a curved orange result in a section of peel pointy on each end and fat in the middle. You can not use longitude lines to measure distance.
Using Degrees and Math
Degrees, minutes and seconds may seem counterintuitive when you work with geographic coordinates. But it's all based on circular geometry, or "clock math." Just like an hour has sixty minutes and a minute has sixty seconds, a degree also has sixty minutes and a minute has sixty seconds. Electronic navigation tools often use decimals instead of second, but the concept is the same. Thirty seconds is half a minute (.500), forty-five seconds is .750, etc.
The only mistake you have to watch for is adding minutes and seconds. While 50 seconds plus 20 seconds equals seventy seconds, with "clock math" that's one minute and ten seconds, or 1"10' or 1.167".
The Poles
Outside of latitude and longitude lines, another other key component of navigation are the earth's poles. The True North pole as a geographic location is at latitude 90° North at the very top of the planet on the axis of rotation of the earth where the longitude lines converge.
But the North pole we use for navigation with compasses, known as Magnetic North, is about 500 Km away from true north, and it drifts. When you're thousands of miles from the north pole, a compass will point to the magnetic pole, not the true north pole. This may be a difference of 15 degrees or more, and the amount of variation is different depending on where you are in the world.
This data is well tabulated and predicted, and we can make adjustments so what you plot on paper matches what you see on your compass.

Reading a Chart
This article teaches reading paper charts, since paper charts are the basis of navigation for chart plotters and electronic charts. There are variations in how electronic charts may display information, especially vector charts, but once you know paper charts e-charts are easy. We’ll take you through each part of the chart, explaining the key information needed for basic navigation. Raster charts on your plotter look just like paper charts.
How to read latitude and longitude lines
At the top and bottom of the chart, you'll see a scale of numbers for longitude. On the left and right edges of the chart, you'll find the latitude scale. At certain points on the chart, reference lines will run from north to south and east to west at fixed intervals. The corners will show you the degrees and minutes where the scale starts, though points on the scales may be marked with minutes or even seconds.
Near the edges of the chart you will often find a distance measuring scale to measure a mile, half a mile, a kilometer, and so on. As we learned already, we don’t need that since we have lines of latitude running down the sides of the chart. Every minute of latitude is one nautical mile, so every chart has a built in scale even if they don't add a separate one.
Scales, Depths, and Notes
Somewhere on the chart will be a bit of text describing in some detail what the chart is. Not all of this applies to plotting a basic route, but it's good to know things like how old the chart is.
Some critical pieces of information include:
- Scale. The chart scale will be a ratio, for example “1:25,000" or “1:500,000". With this ratio, one unit as measured on the chart equals 25,000 of the same units in the actual world. If you measure a centimeter on the chart, it's 25,000 centimeters (or 250 meters) in the real world. One inch on the chart is 25,000 inches in the world, or 2,083 feet.
- Depth soundings. Numbers will be sprinkled over all areas covered in water to show depths. Somewhere you will find the notation "Depths in UNIT" where UNIT is feet, meters, or fathoms. This is significant, make sure you understand what the soundings mean or you may end up aground. Soundings are taken for low tides, there may be water on a spot at high tide.
- Navigational Marks. Any notes on the mark system used and it will probably note the buoyage system.
- Tides and Currents. In areas with noteworthy currents and tidal swings, they may provide critical details.
- Special Marks, Notes or Considerations. Denoted with black, red or purple text, special notes may pertain to anything from fish trap locations, anchorages, military restrictions zones, or anything else which may affect navigation through the covered areas.
Compass Rose
Every chart will have a compass rose. Some may have more than one. The compass rose should have two circles, the outer denoting true north, and the inner showing magnetic north. There will also be variation data to calculate magnetic north from true, and information about the annual expected change in the position of the magnetic north pole.
We will use the compass rose later when we plot lines and courses and measure angles to determine numeric directions.
Depths and Contours
A good chart will have many depth soundings - small numbers on the bottom of the water parts of the chart. But not too many, for readability. It will also have contour lines. These lines connect soundings of the same depth to show you the relative shape of the bottom. Contour lines at ten-foot intervals, for example, will show you how the bottom shallows out or drops off. The closer the lines, the steeper the drop.
Many charts with land on them also show contour lines on land, showing hills and land structures. These are useful to determine where you are from the hills and valleys you expect to see.
Chart colorations are the reverse of what a novice might expect - shallows are blue, shading to lighter colors, then white for the deepest places on the chart. The darker the blue, the shallower the water.
Symbols, Marks and Lights
The most useful information on the chart is the various marks and symbols. Every sailor should have a copy of U.S. Chart Number 1, the master list of all symbols, signs and objects you will see on any U.S. government chart. Some details may vary on charts from other countries, but most of the symbols and abbreviations are used on almost all English language charts. It's a great reference to learn chart reading and is available as a free download. You can also order a paper copy for your nav station.
Aids to Navigation
Permanent government or private marks will be on a chart with a detailed abbreviation describing their markings and how to identify them. Most aids are showing the way around a hazard, or the way to the best navigation channels. Small scale charts without much detail may not show all marks in an area. It’s important to have detailed charts for harbor approaches and coast lines.
Aids to navigation include buoys, day marks, lights, beacons and a few less common marks. The symbols and lettering at each mark describe how you can identify them with color, shape, lighting, and light patterns.
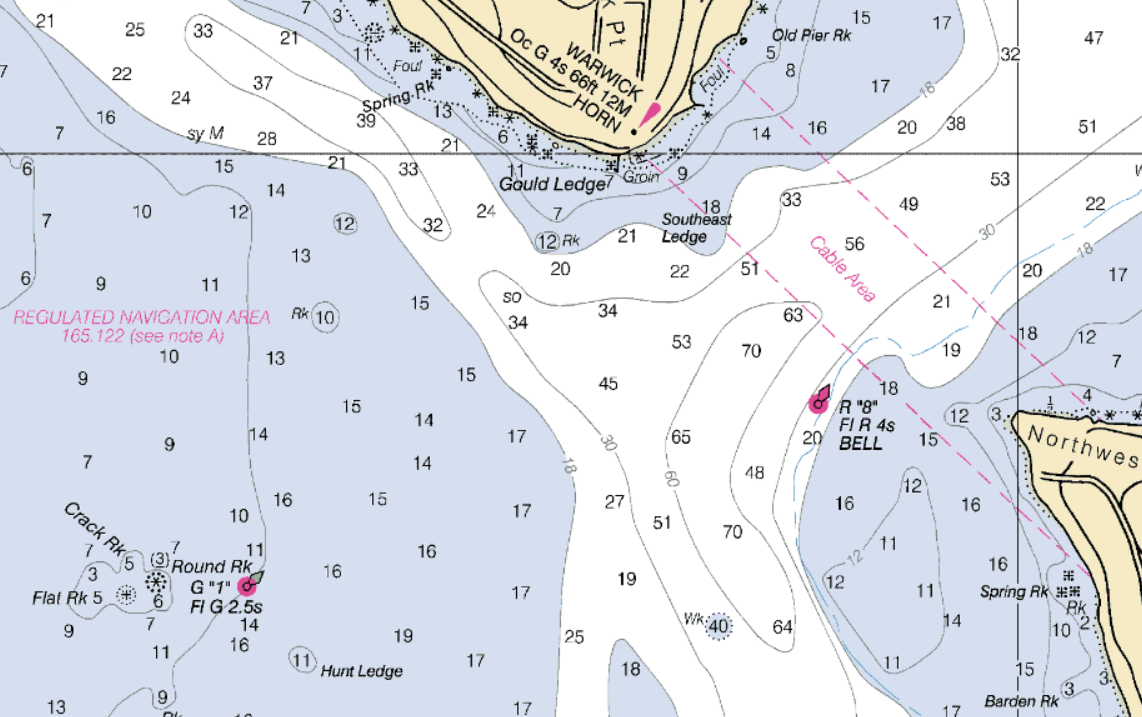
In this example, you can find government two marks and a lighthouse.
- G "1" Fl G 2.5s means green mark,. numbered "1", with a flashing green light every 2.5 seconds.
- R "8" Fl R 4s BELL is a red mark with the number "8" and a red light that flashes every 4 seconds and a bell.
- WARWICK Oc G 4s 66Ft 12M is Warwick Light, with an occulting (mostly on) green light with a 4s cycle. It is 66ft tall and visible for 12 nautical miles.
Most of the descriptions aren't hard to puzzle out once you get the pattern down, but now and then you have to go have a look at Chart Number 1.
Hazards
A chart will also show a variety of permanent hazards and dangers. The example above shows "Round Rk" as a rock awash at low tide. You can also see "Spring Rk," "Old Pier Rk," and "Barden Rk" which do not show as being awash but are shallow enough to be notable. They should show anything which may pose a hazard. Changes since they printed the chart will not be on there. Most chart authorities produce a periodic Notice to Mariners reporting any changes.
Landmarks
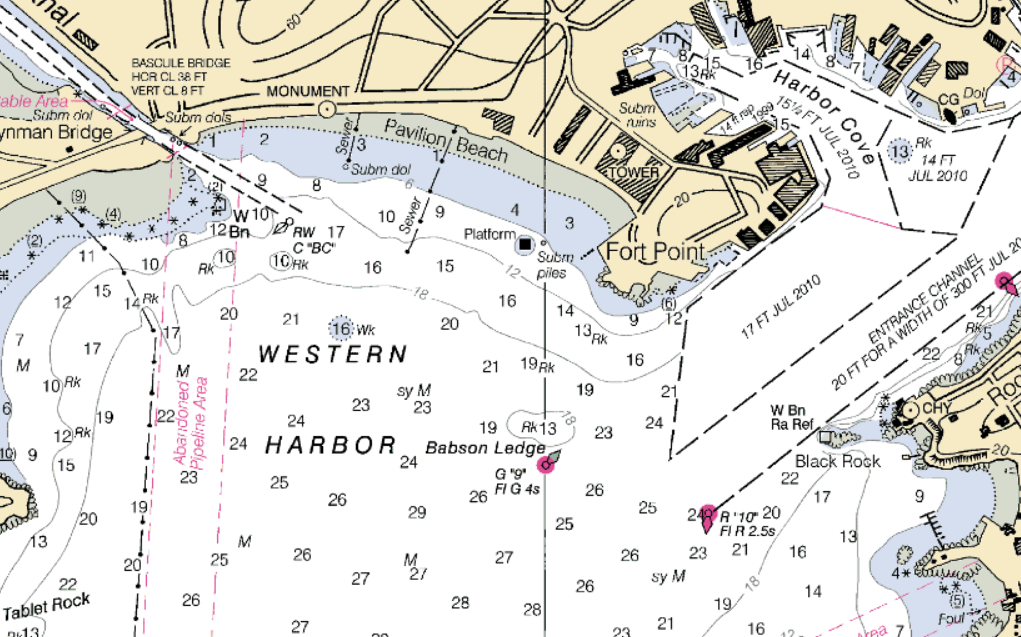
When land shows on a chart, it may show standpipes, towers, flagpoles and other permanent structures if they may be helpful to navigation. You can sight these with a compass to get your position and use them to get your bearings. In the sample below, you can find a monument, a tower, and a chimney as visible landmarks from the water.
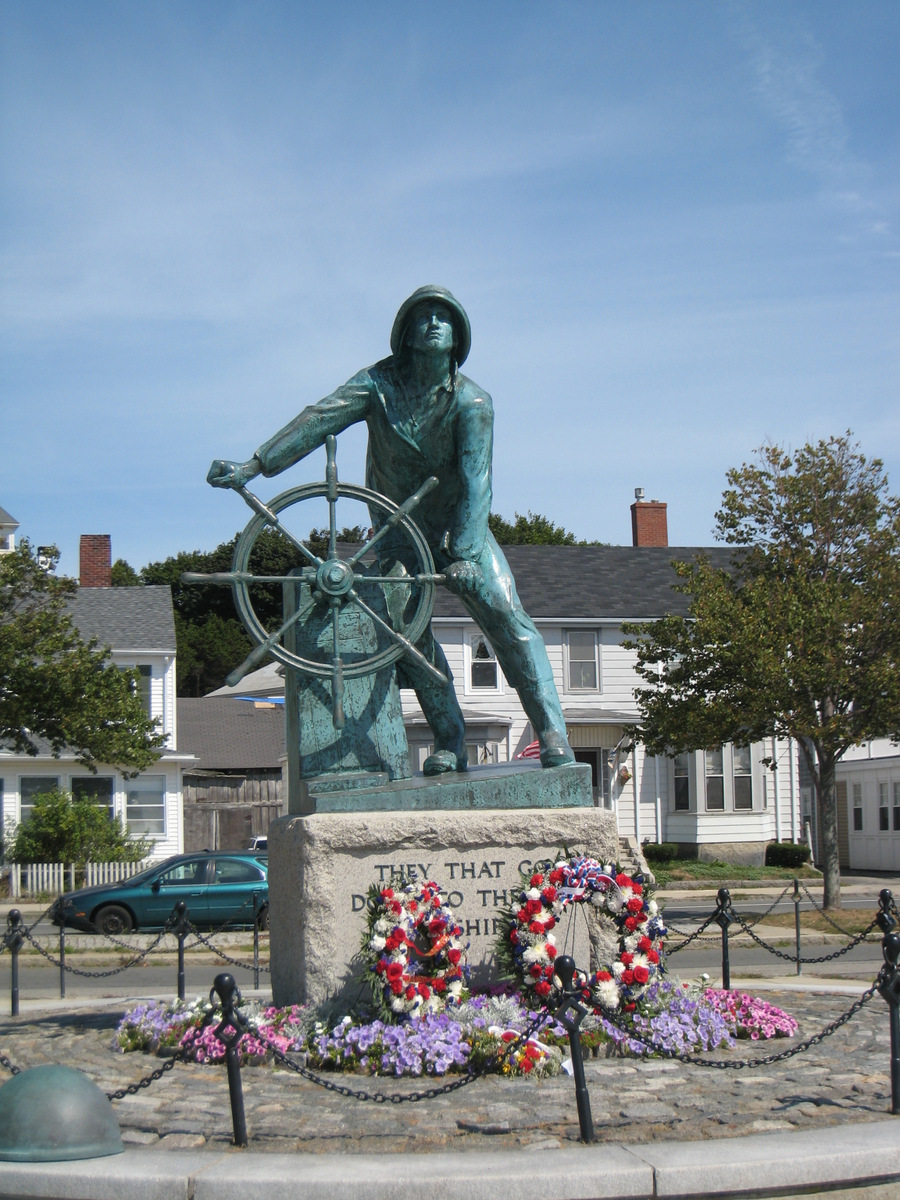
The Gloucester Fisherman's Memorial shown on the chart sample.
Putting it Together
You've got the latitudes and longitudes, depths, landmarks, and aids to navigation. You should be able to read the chart samples to see how you might find your exact location even without a GPS. It the sample chart above from Gloucester, MA, if you sail right to that G "9" marker near Babson Ledge, you will know exactly where you are.
Practice if you can, sitting on your boat or on shore with a chart and trying to pick out the landmarks and aids. Also try it at night.
Using a Chart - Plotting a Course
Plotting a course from one place to another isn't complex, it's a matter of breaking the trip down to segments, or legs, each with a known course and distance and safe to navigate. When you string a series of legs between waypoints around known hazards and land masses to reach your destination, you've plotted a course.
To do this exercise, you will need a paper chart, a sharp pencil (not a pen), a parallel ruler, a set of dividers (sometimes called a "compass"), a starting point and a destination.
Learn to Plot Your First Course
If you have never plotted a course before, we recommend first reading our full guide on how to plot your first course. It will walk you through the entire process step-by-step.
Laying in the Course
To plot a course, first look over the chart to see what is between your start and your destination. You can even trace a rough course with your finger, noting hazards like islands, shallows and rocks you want to avoid.
Make a mark at the start of your course, a buoy outside your marina is a common starting point. From there, pick a point in the general direction of your destination with no hazards between the start and the first mark. Placing a mark near a government aid is convenient, but do not put your mark ON the aid to navigation. For one, you don't want to hit the mark, so don't aim right at it. Second, everyone else is plotting to that mark too, and you don't want to pile up on the water if visibility gets poor.
Place your mark a little away from the government mark on the safe navigation side. With the straight edge of your parallel rule, draw a line from the starting mark to the first mark. Check the line to make sure it doesn't run over any hazards or depths shallower than your draft. If you find problems, erase the line and pick another point and repeat.
Once you have a safe first leg, find another mark on the way to your destination from the first leg. Draw another line to the new mark and check for hazards. Repeat this process for each leg until your last leg ends at your destination. Your course shouldn't run through any shallows or hazards.
When the line is complete, it still needs to be measured and marked before you know what courses you have to steer to get where you're going.
Measuring Lines and Marking Your Course
We use parallel rules to create lines with a known compass heading, or to measure the compass heading of line you drew on your chart. The compass rose is the gauge to measure and draw your lines. We will use the parallel rules and the compass rose to measure the course to steer on each leg, and the dividers to measure the length.
The Course to Steer
Take the outer edge of your parallel rule and place it along the first leg of your course. Now, pressing gently on the rule on the course to hold it in place, move the other ruler away from the line towards the compass rose. With luck, you'll reach it in the first move. Most of the time you will have to "walk" the ruler across the chart to the compass rose. The goal is to maintain the same angle on the rulers as the line you're measuring, so take it slow and smooth and don't make jerky motions. If you wiggle the rulers, start over.
Maintaining pressure on the first ruler, open the rulers toward the compass rose. When you can't move it any more, put pressure on the leg you just moved, move the other leg up until it's touching the leg you're holding down. Then put pressure on the first leg again and open the rulers towards the rose. Repeat and walk the rulers until you reach the center point of the compass rose with the outside edge.
Once the edge of the ruler is through the center of the rose, read the headings from the points on the outside of the rode. The outer circle will show numbers for the true bearing, the inner circle is for magnetic. Note the bearing on a scrap of paper.
In the center of the compass rose, you will see a measure for variance on the north line of the compass. This is the difference between true and magnetic north on the current chart. Next to that will be a year, with a number and direction. For example, it may read 18°35'E 1994 2'E. This tells you your compass will read almost 20 degrees from true, and it the variance changes two seconds every year.
In most cases you can ignore that, unless your chart is very old or the annual change is large. In 2020, the chart above has 26 x 2' = 52' of additional variance, or almost a degree change in heading. If (years ago x annual change) is less than a minute you can usually ignore it for short legs. A degree change in course on a five or ten mile leg won’t take you out of sight of your next mark. If it's significant, for East variance, you ADD the annual change to the magnetic course you recorded, otherwise subtract it.
When you have the final magnetic course measurement, write it over the course leg with a "C" for course, the course, and "M" for magnetic. If your course is less than 100° put a leading zero on it to avoid ambiguity. For example, record a 92° magnetic course as C 092M, or 273° we write as C 273M.
Leg Distance
There are several was to use dividers to measure your leg lengths, you'll figure out which works best for you and some techniques work better in some situations than others.
The easiest is, if your leg is short enough, to spread the dividers between the two points on the leg. Then move them to the latitude scale on the side of the chart and see how many minutes of latitude they spread out. That is the leg length in miles. You may have to interpolate or make a rough guess at partial seconds on large-scale charts.
Another method is to open the dividers a fixed, measured distance such as a mile. The choice depends on the length of your leg. Put one divider leg on the starting point of the leg, and the second leg on the course line. Now rotate the dividers around the second leg and put the first leg on the mark. Walk the dividers down the course line while counting how many lengths you measure, then you have the miles in the leg.
Except for the last rotation, that will be a fractional distance and the divider leg will go past the mark. Push the dividers together until the leg is on the mark, then measure on the latitude scale how long the fractional amount is.
Record the leg distance under the course like with “D” plus the length of the leg and the units you measured. A 7.8 mile leg we write as D 7.8 NM. If you use a different unit, note it. But most sailors do navigation with nautical miles.
You will want to complete these steps for each leg of the trip. I also like to record the course details and the Lat/Long of each waypoint on a separate sheet for easy reference during navigation.
Measuring and Plotting Points
To measure a point and get the geographic coordinates, find a government mark on your chart, like the "R8" in the first example chart. You can see two reference lines on that chart, one for one for longitude and one for latitude. Find the reference lines on your chart and follow them to the edge; and you will see the actual latitude or longitude.
With the divider, put one leg on the mark you picked to measure. Expand the dividers to put the other leg on the nearest latitude reference line, measuring shortest difference between the two. If you drew a line from the mark to the line, it would be perpendicular to the line so visualize that as you measure. If you rotate the dividers on the leg on the mark, the measurement will be right when it only touches the reference line in one place.
Now move your dividers to the latitude scale on the chart and put the reference line leg on the same line on the scale. Be careful not to change the divider measurement; most will be tight enough to stay fixed. The other divider leg will sit on the actual latitude reading for the mark. The scale will vary with the detail of the chart, but you should be able to record a full latitude reference from that point. If it only shows minutes or seconds, look at the top or bottom of the scale for the degrees and minutes. Write it all down.
Repeat the process with the longitude reference line. When you finish, you will have the Lat/Long coordinates of the point you measured. You don't have to do this for a manually plotted course, but it's not a bad idea on principle. And you will need to do it if you plan to enter the manual course into a GPS or chart plotter.
Want Another Course Plotting Example?
If you have never plotted a course before, we recommend first reading our full guide on how to plot your first course. It will walk you through the entire process step-by-step.
Dead Reckoning - Pulling it all Together
Now that you can read a chart and plot a course, it's time to put this knowledge to work. Before chart plotters and the GPS, sailors navigated by dead reckoning. When old-time sailors used a sextant to get a position, they could only use it to calculate their latitude. We cannot derive longitude with celestial navigation, and few sailors knew the math to make it work, anyway.
Dead reckoning is nothing more than estimating your position on a chart using your known speed and course. There is a specific notation to record this, and techniques to refine the accuracy when you can fix a position. You need a speed log and a compass, with that you can estimate your position from a known starting point.
Note - many consider Dead Reckoning an obsolete skill in the age of the GPS. While there is some truth to this, it is an important skill to have in case you find yourself without a GPS or chart plotter. It's an excellent backup, and like plotting a course on a paper chart, it keeps you in tune with and alert about the waters you're sailing through. Electronics fail; when we're offshore we record our position hourly on paper, just in case we need to start a DR plot due to instrument failure.
Making the Basic DR Plot
Somewhere in your plotted course, you will pass known government marks or a reference that will give you an exact position fix. You can cheat and use a GPS if you must, but don't refer to it after that in this exercise.
The general process is:
- Every hour on the hour, note your speed through the water and magnetic course on a piece of paper.
- On your paper chart, find the last dead reckoning point (or known fix).
- With your parallel rules, move a line with to your magnetic course to the last known mark. This is the reverse of measuring the line. Put your parallel rules on the course through the center of the compass rose, then walk that line to your last DR mark.
- Draw a line on your course the same length as your average speed in knots from the last mark.
- Put a dot on the mark, and a half circle around the top half to show it's a DR position.
- Record the time under the DR mark and note speed and distance on the line between the points.
There are a few more specifics, but that general process will give you an estimate of roughly where you are.
If you make a course change, add a DR plot at the change. If you don't change course on the hour, you will have to do a little math. Draw the course line to the course change in the same way, but the length of the line will have to be a fraction of your boat speed. This is the number of minutes since your last DR position divided by 60 minutes. Multiply this fraction by your speed to get how many miles long the DR line needs to be at the course change.
Dead Reckoning Errors and Inaccuracy
At its best, DR plotting is a good estimation of your position. You want the best estimate you can, and there are factors which will push your DR plot away from your actual position. Do not treat dead reckoning positions as an actual fix, DR is a tool to get you to a place where you can get a better fix from an aid to navigation or a landmark for accurate navigation.
Some factors which can reduce the accuracy include:
- Current. Tidal currents may be invisible to you, but a one knot current sweeping you sideways or pushing you backwards will make your DR estimate off by a mile after an hour. If you know the currents for an area, you can correct for this by adding a vector for the current to your DR course and speed line and plotting that as the DR position. Note the correction on the plot.
- Leeway and drift. Similar to current, but leeway is sideslip in your boat. All sailboats sideslip a little, it's the nature of the forces that make a boat sail against the wind. The heading on your compass will not fully match your forward progress as your boat slips a little away from the wind.
- Variable Speeds. The best you can do for your estimates is the average speed of your boat over an hour. If the wind is variable this may be difficult to figure. Do your best, but if you have a big lull for half an hour, think before using the full boat speed if the wind picks up before you record your DR.
- Compass Deviation. Metal objects on a boat can affect a compass heading. The effects vary with the direction the boat is heading. Imagine a compass with a magnet a foot away. The compass will point mostly north, but a little towards the magnet. Now move the magnet in a circle around the compass; the readings will change slightly but still stay mostly north. On your boat, the magnetic interferences will change as the boat sails in different directions. A profession can “swing” a compas and give you a deviation card for your boat. You use this to build the known deviation into your courses to eliminate this inaccuracy. Most electronic compasses calculate deviation during calibation, consult your manuals and calibrate if you aren’t sure if your compass is calibrated.
Correcting the DR Position
The longer you sail on dead reckoning, the more inaccurate your estimated position will be. If you're sailing near shore, you can correct this by fixing your position, or getting a known position to correct your DR plot and start plotting from the new accurate position.
A simple way to fix your position is to sail near a mark on your chart. For coastal navigation, you've likely plotted your course relative to government marks because they are convenient. This is to give you a periodic fix as you pass waypoints on your course. When you come close to the mark, record your position with the time, and circle the position dot to show it's a "fix" and a good known position.
Another fix technique needs at least two visible landmarks or aids to navigation you can identify, and a hand bearing compass. To start, take a bearing on the first point and record it. As quickly as you can, record a bearing to the second mark. If you have time, repeat the bearings. You want to hurry because the boat is moving and the more time between bearings, the greater the error.
Find each mark you took bearings for on your paper chart, then take your parallel rules and draw a line from each mark on the sighted heading. The marks should intersect, and the intersection is your rough position. If you took multiple bearings, you can draw more lines to get a sense of the uncertainty introduced by your boat speed. Circle the intersection and note the time, then use this as the basis for your next DR plot. This is less accurate than finding a mark, but will let you correct your DR plot for accuracy.
There are several other techniques such as the running fix and more complex uses of a compass, landmarks, and math that are outside the scope of this guide.
Dead Reckoning and the GPS
GPS navigation makes all this DR plotting seem like a lot of unnecessary work. That doesn't mean it's not worth learning and doing. On coastal cruises it keeps us tuned in to the sailing, though we also record GPS fixes on shorter legs and at course changes.
It is important that sailors understand not only how to push the right buttons on the chart plotter, but how navigation works. Not that we're expecting a calamity that will take down your electronics or make the GPS system unreliable, but it can and has happened.
Electronic navigation makes all of this very simple, but it's good to know how to find your way without it.
Master Chart Navigation with One Course
When you're ready to master chart navigation, I recommend you check out the Coastal Navigation course at our partner NauticEd. It is quite excellent. They cover chart navigation in-depth and will guide you through multiple quality exercises to make sure you really practice your new skills. It is really affordable as well.
You'll leave Coastal Navigation Clinic with an understanding of:
- The Charts and how to use navigation tools
- True north and magnetic north - and variation and deviation
- Determining your position using various techniques such as dead reckoning, running fixes and triangulation
- What to do with your GPS position to get you to your destination
- Set and drift from wind, tides and current
- How to simply determine your heading based on Set and Drift
Check out NauticEd's Navigation Clinic now.
Did you find the answer to your specific question?
👍 3 👎 7
Comments
Alan
Hi
Anybody can help and tell me how to find a one to one tutor to teach navagstion plotting?
Shawn
Hi Alan, you can find a great course on navigation at NauticEd. I’ll email you the link.
Kira
Thanks for this article! I found it helpful and easy to understand. In the section “Dead Reckoning - Pulling it all Together” you wrote, “we cannot derive longitude with celestial navigation”. A method using lunar distances to find longitude first started being used in 1763: https://en.wikipedia.org/wiki/Lunar_distance_(navigation)
Lynette Rolland
This is quality work regarding the topic! I guess I’ll have to bookmark this page. See my website <a href=”http://psfond.ru/bitrix/redirect.php?goto=http://article-star.com/eine-effektive-html-sitemap-erstellen">Article Star</a> for content about SEO and I hope it gets your seal of approval, too!
Leave a comment