How to Read Weather Charts for Sailing
Next to an accurate chart, a solid weather forecast is about the most important piece of information you can have when sailing. Weather forecasters on television stand in front of weather charts and make large-scale predictions, but they aren't usually the type of forecasts we need for sailing offshore.
Learning to read a weather chart yourself is an excellent tool to have along with professional weather forecasts and helps you learn the larger weather patterns around where you sail and where you're headed. And if you sail where there aren't good forecasts, it's important to know how to interpret the data that is available to you.
To learn to read a weather chart isn't possible without some understanding of how weather works, and learning what information is available on a chart for you to draw conclusions. But don't worry, we'll break down the basics for you so you can make some sense of that weather chart.
Types of Weather Charts
Most weather websites have weather charts, though they're often embellished with forecast information from meteorologists, or additional symbols and notes. But those animated screens TV weather people point at and the more developed forecasts on weather websites are based on underlying weather information.
We're going to look at the basic, uninterpreted weather charts so you can understand the underlying information and learn to interpret it yourself. Several governmental agencies provide weather charts free to anyone who wants them, like the National Weather Service in the U.S., the U.K. MetOffice, Meteo France, and almost every other sea-going nation.
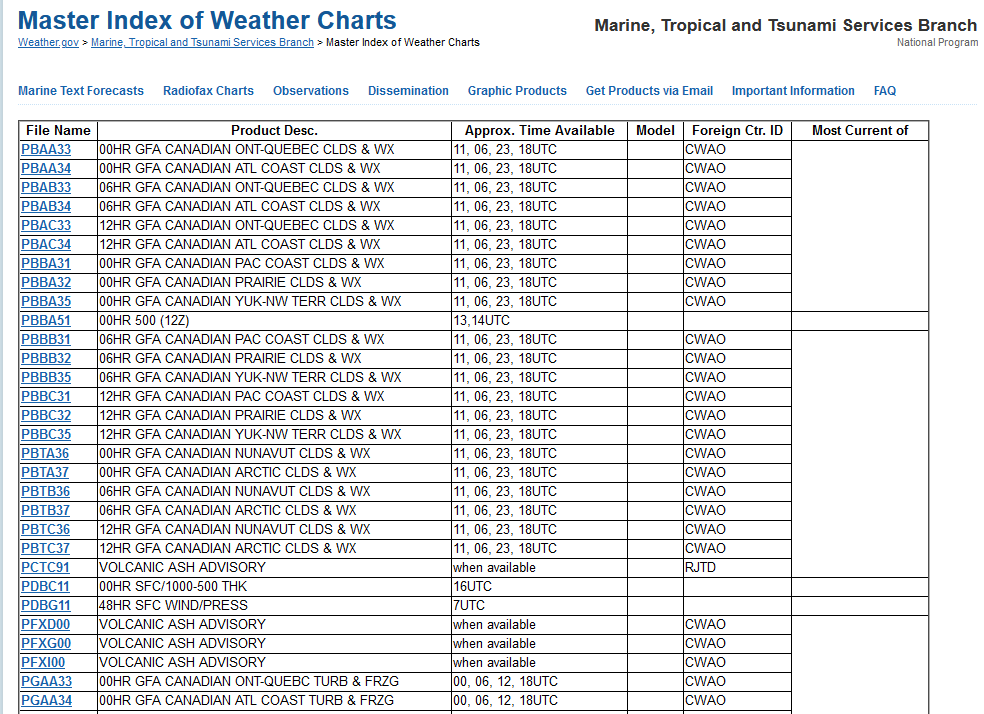
But the array of weather products is quite dizzying. The "Master Index" of weather charts from the National Weather Service has hundreds of entries, with everything from surface pressure analysis to volcanic ash advisories and ice warnings. What are the charts that you need?
Synoptic Charts
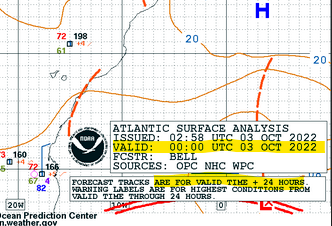
The primary chart that most turn to for basic weather is the Synoptic Chart. It may also be called a Surface Analysis or a Surface Chart, because it is based on conditions and observations at the surface of the earth. It is a snapshot in time of the conditions over a large area of the planet, showing general conditions and weather systems and how they are moving.
On a surface analysis chart, you'll find the location of high and low pressure systems, fronts, troughs, ridges, and the range of air pressures, as well as some references to wind strengths, directions, and conditions. The detail on the synoptic chart will vary, as chart delivery via services like weather fax only allows for black and white charts and little detail. But full color synoptic charts may hold a lot more information than a weather fax you pull down offshore over marine SSB radio.
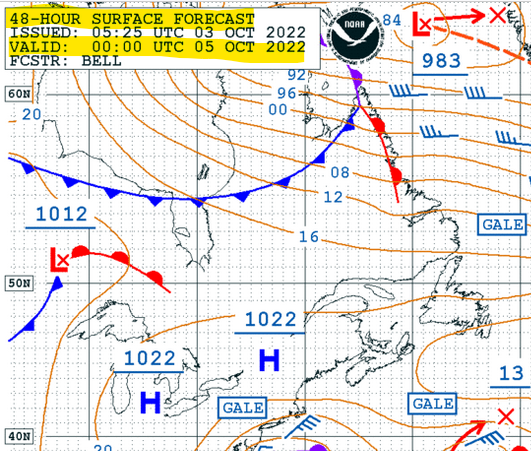
A synoptic chart is valid only for a certain amount of time from its creation, so always check the labels. And some charts are projections forward - what expect the chart should look like 24 or 48 hours from the time of forecast.
This article will focus primarily on synoptic charts and forecasts and how to use them.
Global Weather in a Nutshell
You can't understand a weather chart without knowing a little about weather. Learning to read a chart is a good way to learn about weather because they two are so linked. It's like learning about a marine chart without learning a little of navigation. It makes little sense without it.
There are several overarching features of our planet which contribute to weather on a large scale. They affect the movement of weather systems, the direction of wind, and how weather is created on a global and regional level. While it's very hard to predict the exact weather for a specific town or village, studying global forces will help predict the weather over a larger area.
Atmospheric Pressure
Atmospheric air pressure, or barometric pressure, is the weight of the atmosphere pressing on the surface of the earth. Picture a column of air one inch square (2.54 cm x 2.54 cm) extending from the surface of the earth at sea level to the top of the atmosphere. That column of air normally weighs about 14.7 pounds, so this is the "normal" atmospheric pressure in pounds per square inch (psi), or one atmosphere.
Very few weather reports use PSI as a scale, as they've moved to the metric system, or the International System of Units (SI). The most common measure seen on synoptic charts is the millibar (1,013.25 mb or mbar = 1 Atmosphere), though pressure may also show in millimeters (760mm) or inches (29.92 inches) of mercury (Hg), referring to the height of a mercury column in a liquid metal barometer. Rarely will pressure be shown in Pascals (101,325 Pa), the SI measurement for pressure.
Air pressure varies with altitude, so standard pressure is at sea level and measurements taking inland at elevation are adjusted to sea level normal.
Coriolis Effect
A Coriolis "force" isn't a genuine force, it's the deflection effect on the motion of an object in a rotating frame of reference.
Picture a flat circular disc, stopped, with a ball sitting at the center of the circle. Now, push the ball out from the center, and it will trace a straight line across the circle to the edge. Now picture that disc sitting on an old-style record player, spinning. Push the ball out from the center and what happens?
It moves in a curve. Or does it? It looks like it moves in a curve, if you're sitting outside the rotation as a fixed observer. But the effect is the same. The line traced across the surface curves. There is a "spin" or curve added to the motion of the ball as it moves.
The amount of "spin" depends on the speed of rotation, as well as the interaction between the spinning surface and the ball. A felt disc with a lot of friction will affect a ball much more than a smooth surface.
So how does this relate to the weather?
Imaging the earth, spinning at one revolution per day. That's seems slow, but it's 1,037 miles per hour at the equator, or 733 mph at 45 degrees of latitude! Large moving masses of air are like that ball in the middle of that spinning disc. Their effective motion changes relative to the surface as they drag against the surface of the earth, changing wind directions and imparting spin.
In the northern hemisphere, among other effects, this deflects north moving winds to the east. The effect is opposite in the south, where winds deflect to the west. On a larger scale, the Coriolis effect contributes to the cyclonic (circular) motion of weather and pressure systems.
On a small scale, the Coriolis effect is too small to notice, but on a global scale it has dramatic effects on weather patterns.
Pressure Systems
Pressure systems are the building blocks of weather. They move around the world in mostly predictable patterns and have a few defining characteristics that let us draw some conclusions about how they'll affect surface weather as they move through our locale.
Pressure systems are linked to the temperature of the air masses. Colder air is denser, so more air can pile up on cold systems, creating high pressure. Conversely, warm air is less dense, so the air pressure above us is lower, since the air is less dense.
Please note - the general spinning movement of pressure systems in the northern hemisphere is directly opposite their movement in the southern hemisphere. For clarity, we'll talk only about the northern hemisphere, but assume everything spins the other way if you're down under unless specified otherwise.
High Pressure Systems
Colder temperatures and clear skies characterize high pressure systems. In the northern hemisphere, they rotate clockwise, and air at the surface flows out from the center of the system as cooler air in the middle presses downward and pushes it outwards.
Low Pressure Systems
Low pressure systems are warmer, and usually lead to cloudy temperatures, rain, and sometimes very severe weather. The spin counter-clockwise, and air flows INTO a low pressure system, as warmer air in the center rises and air rushes in from the sides to fill the gap.
Wind and Pressure
Wind comes from a variety of sources at the earth's surface, and all these wind forces add up to make the wind we feel.
Air flows naturally from high pressure areas to low pressure areas, creating a gradient wind, the large-scale wind caused by differences in air pressure. The gradient wind trends across enormous areas between air masses.
As mentioned above, low and high pressure systems have rotation, which causes a wind effect, and they have internal airflow and winds. The Coriolis effect doesn't cause airflow so much as deflect it to the east, but this needs to be accounted for in wind predictions.
On a local level, temperature differences between water masses or between the water and land can create additional winds, like an on shore breeze in the afternoon in most coastal areas. Land effects and structures on shore also affect local breezes, channeling, blocking, or changing directions on a micro scale, though does not influence offshore winds.
The local wind direction you feel while sailing is the combination of all the above - the general gradient wind, deflected by Coriolis forces, and local temperature and topography variations. Off shore breeze is a little more predictable and consistent because it isn't much affected by land masses.
Fronts and storms
The leading edge of a mass of air is a front, and usually represents disturbed or changing weather. A warm front is the area where a mass of warm area moves into an area dominated by cold air, and a cold front is a cold air mass overtaking warmer air.
Warm air is less dense than cold air, so a lighter warm front meeting cold air will slide up over the cold air mass. This cools the air mass and forces it to release trapped moisture into clouds and rain. This is generally more constant rain but lighter rain over a longer period than you will see from a cold front.
Cold fronts move faster than arm fronts, and will push under a mass of lighter warm air. This cools the warm are, leading to more abrupt and sometimes violent and colder weather.
When a cold front catches up to a warm font, they may combine into an occluded front. These often produce precipitation and a sharp drop in temperature in their passing.
Making Sense of the Chart
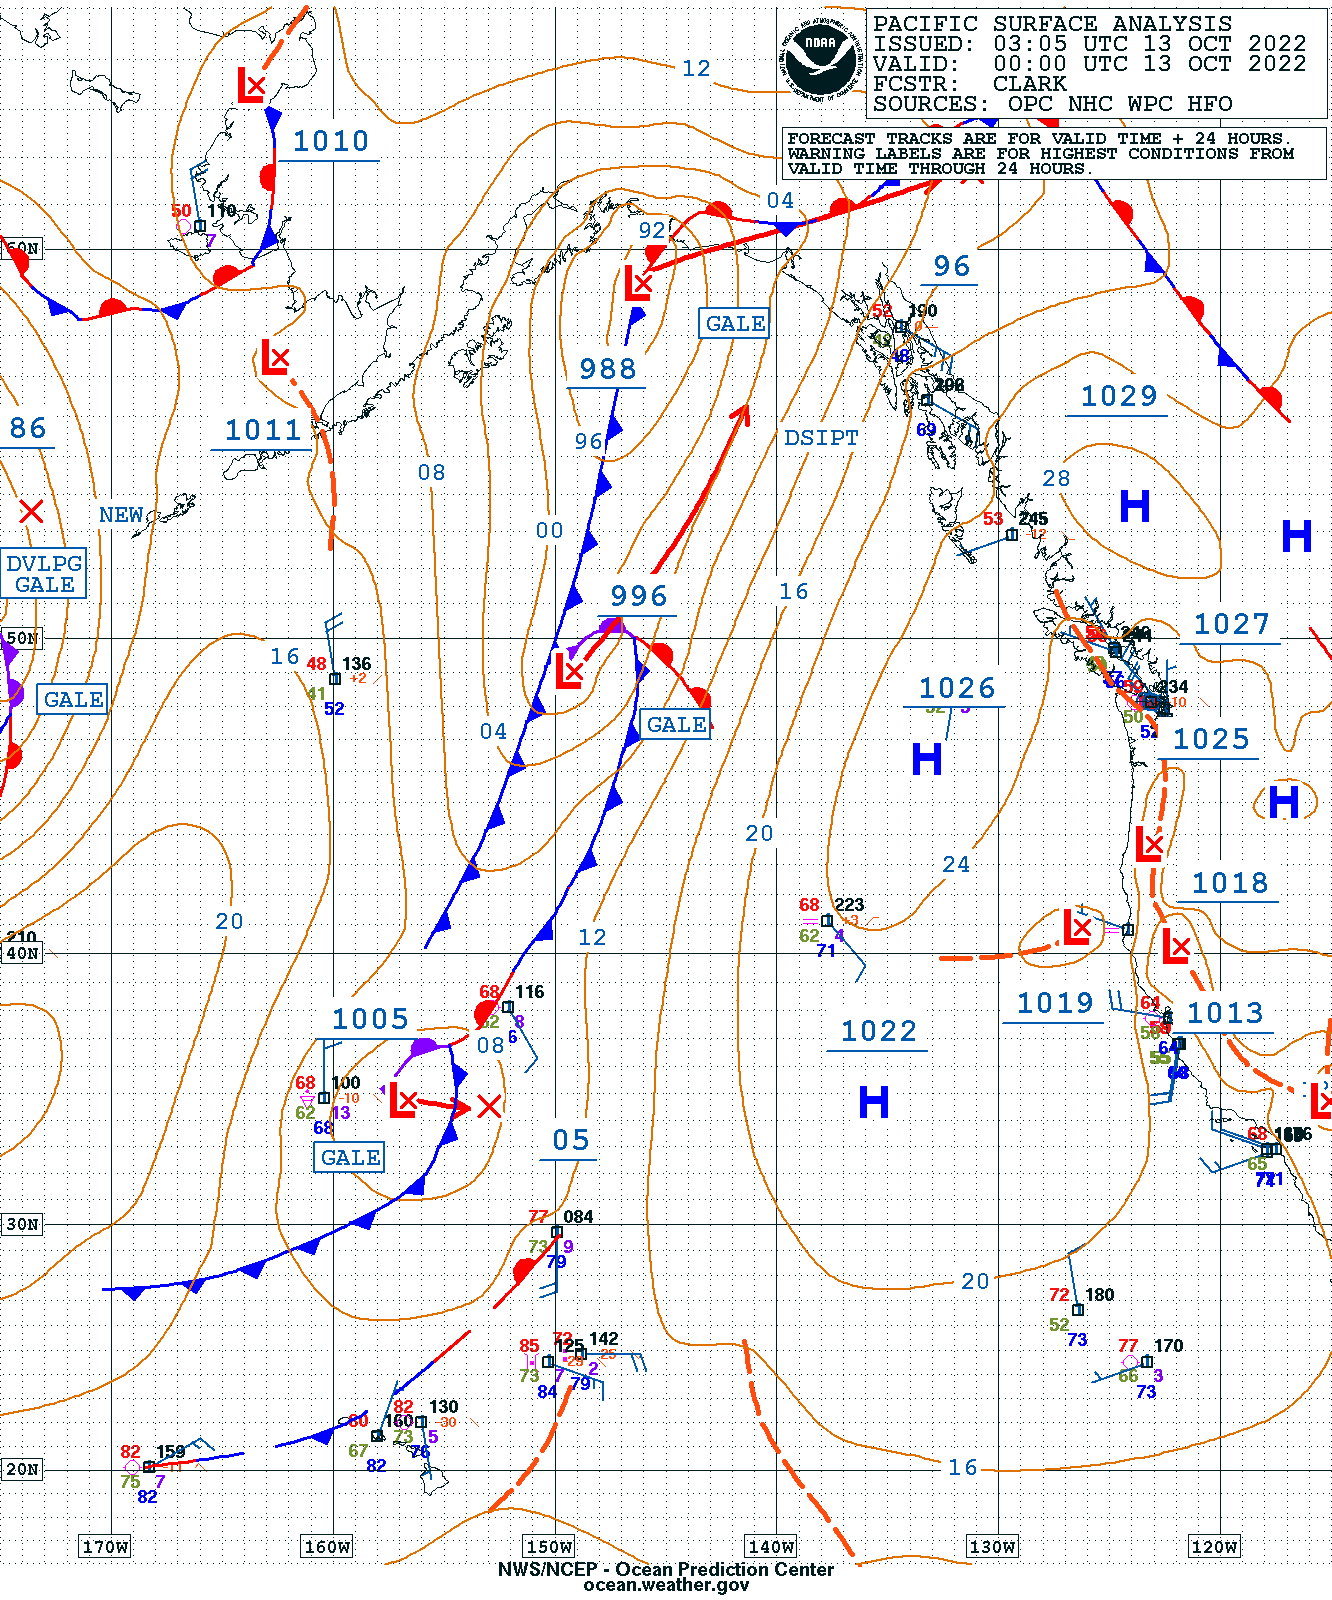
To explain the symbols and talk a little about what you'll find on a weather chart, we'll use this Pacific Surface Analysis chart. This is a real chart from the NOAA list of Radiofax Charts for the North Pacific and Tropical East Pacific.
Study it for a minute, and see if you can guess what the symbols mean from what we learned already, and refer to it for all discussion. Most charts are available in color, which improves readability. But sometimes, you may only have black and white charts.
Charts received over marine SSB and weather fax are in black in white, as are some less popular charts. Black & white images are also smaller and easier to download with limited offshore bandwidth. They contain the same information but no color codes, so recognizing the shapes and lines is more important than the colors.
At the end, we'll give you the NOAA key to all the symbols, but we'll talk you through each one on the way.
Information Box
Any weather chart will have a box describing the covered region, type of chart, issue date, and an expiration date. Given that large charts cover multiple time zones and are used all over the world, they give times and dates in Universal Coordinated Time (UTC) to avoid local time zone conversion. So you will need to adjust for local time yourself.

Pressure Systems
High and Low pressure systems are designated with a large blue H or a large red L. They will also have an underlined number near the letter. This is the atmospheric pressure reading in millibars at the center of the pressure system. The sample chart shows an intense Low with a 988 pressure reading in the Gulf of Alaska, and a high in the north Pacific off of Washington state reading 1026, among several pressure systems.

High Pressure System

Low Pressure System
Low pressure systems often have an arrow showing expected movement in the coming 24 hours, with pressure changes noted.
Isobars
Each pressure system is surrounded by blobbish circles with numbers. These are isobars. Like depth lines on a chart or altitude on a topographic map, they show the lines of specific measurements - in this case, atmospheric pressure. The space between them may vary, but the closer they are together, the steeper the gradient.
The numbers are usually the last two digits of the isobar reading, to remove clutter. Referring to the 988 millibar Low in the Gulf of Alaska, you can see lines in increments of 4 mb heading out, increasing to 992, 996, 1000, and so on.
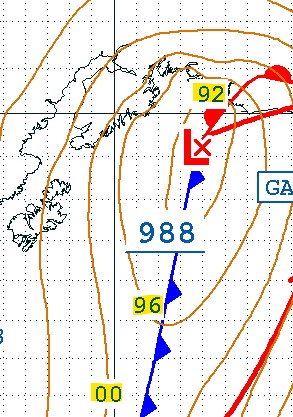
If the two digit number (XX) is low it's a 10XX mb measure, higher numbers are 9XX. So in the above example, the isobars represent 992 mb, 996 mb, and 1000 mb.
Fronts
Cold fronts are long blue lines with triangles on them, and warm fronts are red lines with semi-circles. The shape is on the side of movement, so you can predict their general motion in the coming days.
Occluded fronts are shown with a mix of semicircles and triangles; on color charts, they will alternate blue and red colors.
Cold Front
Warm Front
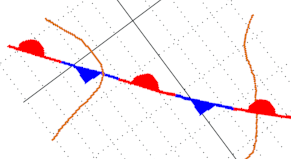
Stationary Front
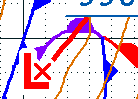
Occluded Front (in purple)
Wind Arrows and Station Plots
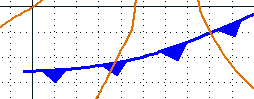
Wind arrows show wind speed and direction. The "feathers" show the strength, and the arrow points in the wind's direction. Each large feather represents 10 knots of wind, half feathers are 5 knots. This is an expected range within a few knots of breeze, not a precise measurement.
A station plot usually accompanies wind arrows with measured data from a vessel or land station.
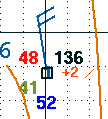
This wind arrow shows 20 knot winds north-north-westerly winds. Next to it are color coded numbers keyed (clockwise from the top left) for temperature (red), dew point (green), sea surface temperature (blue, in degrees Fahrenheit on NOAA charts), atmospheric pressure (white, the last three digits including a decimal), and three-hour pressure change (orange, tenths of a mb).
This station plot shows NNW winds at 20 knots, 48°F air temperature, 41°F dew point, 52° SST (sea surface temperature), 1013.6 mb barometric pressure, with a +.2 mb increase over the last three hours.
Station plots may optionally include a ship identifier if it was reported by a vessel, present observed weather, and wave height. Colors and units also may vary by chart provider, so double check for units if you're getting data from outside U.S. based sources as it may use Celsius temperatures.
Troughs and Ridges
Sometimes an extended area of low (trough) or high (ridge) pressure can run along the edge of a pressure system, or between pressure systems. They aren't centered around a cyclonic high or low pressure systems.
Troughs are characterized by unpleasant weather, and passing trough can cause extended periods of wind and rain. As you might expect by now, a ridge of high pressure gives mild and clear weather.
Troughs (abbreviated TROF) on NOAA charts are shown with an orange dashed line, ridges with a zig-zagged yellow line.
Note that ridges and troughs are not marked consistently on all charts. Weather authorities outside NOAA may use different symbols. For example, the UK uses a bold line from a low pressure center. You can also be spot them on a chart by compressed isobars in a region of low or high pressure.
Notes, Warnings, Comments and other symbols
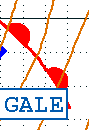
Text blocks and boxes may have notes and warnings on the chart. Some are quite specific in meaning, for example, gale, storm, and hurricane (HURCN) are warnings to expect a range of unpleasant conditions.
Gale = 34-47 knot winds
Storm = 48-63 knots
Hurricane Force = winds over 64 knots.
Depending on where you sail, you may find ice warnings, freezing spray, and other conditions noted with additional comments and symbols. Refer to the keys and links at the end of this article to puzzle out unfamiliar notations.
Interpreting the Chart
Reading the chart is good, but like a navigation chart, just because you learn the symbol for a buoy and what the numbers mean doesn't mean you can navigate, right? Reading the symbols is the first step, but looking for meaning in them is another thing entirely.
Creating a detailed, accurate forecast for a region is way beyond this article. There are undergraduate and graduate degree programs to help make accurate forecasts, and we know even with that much education how imprecise they still can be! Precise local predictions on a small area are difficult, and you will get the best analysis from professionals.
So why bother reading a chart yourself?
The main reason is to get a sense of the larger weather patterns, so you can plan your passages and know what weather you may expect. Even if it’s not for a passage planning, you can look ahead for conditions for your two-week summer vacation. Two weeks out isn't very accurate, but if you're watching the charts change every single day, you will see patterns emerge.
The other reason is that most "Weather" forecasts we see on TV and in papers are for people trying to figure out if they need to bring an umbrella to work or if it's time to dig out the snow blower. There is very little detailed prediction made for offshore conditions. So it's good to know for yourself what is happening, so the marine forecasts we can get make more sense.
A Thought Exercise
Suppose you're planning a long offshore passage heading west into the Pacific, and you see a high pressure system between you and where you're headed. What sort of conditions can you expect? Should you sail through it, around it to the north, or around it to the south?
Remember what we've learned about high pressure systems:
- They're characterized by milder conditions and lighter winds.
- They rotate clockwise in the northern hemisphere.
- Air flows out from the center to the edges.
By understanding these facts, you see if you plow through the middle of the system you may find yourself motoring across a light wind area. With a clockwise rotation, winds on the northern edge of the high will be more easterly with a north deflection, and at the south edge they will be more westerly with a southerly deflection. Though both will have some Coriolis deflection, it's a reasonable trend you can observe with station plots.
Since you're sailing west, if you can sail down to the southern edge of the high pressure system, you'll have more friendly winds than at the northern edge, where they'll be in your face. If that takes you too far out of the way to make your destination, that's another piece of information you have about the conditions you'll expect on the trip - plowing through the windless middle may be better than sailing upwind to the north.
Depending on the length of your trip, you can look past the current air masses and see the movement of any lows or troughs you may come across if you'll be out for a few days. The weather forecasters don't know where you're sailing, only you do.
For longer term planning and weather routing, the more you know, the better your decision making will be.
Understanding the Forecasts
The biggest takeaway from reading charts yourself is understanding the forecasts you get from a variety of sources and weather models. Most regional forecasts are pretty solid for 48 to 72 hours, but even then conditions can change quickly. So what you're looking for on the weather chart is "what's out there" that could affect the predicted conditions or affect you outside that 72 hour window.
One of the most important decisions offshore sailors make is the "go/no go" call at the start of an ocean passage. When you're facing a trip of a week or more, it's easy to get excited to depart when the weather is lovely and there are clear skies. But what will the weather look like 2-3 days later when the air masses have shifted and you're five or six hundred miles from where you started, too? Leaving in nice weather only to get pasted by a Low halfway through the trip is a terrible choice. But we have the information to minimize that risk.
You should always look at every weather source you can before sailing offshore, or even heading out for the weekend. Then, take what you've learned, look at the charts, and try to match up what you see on the charts with the forecast you saw. Then, look ahead and see what's coming that's not in the short-term forecast.
Other Useful Charts
Back at the beginning of this article, we saw a long list of weather "products" offered by the National Weather Service. Every weather agency produces a bewildering array of charts, but some of these are very useful for sailors and deserve a brief mention.
Sea State Analysis
This chart shows significant wave heights and direction on a large scale. The numbers represent the average wave height of the top 1/3 of the largest waves in meters. Yes, those really are 25+ foot waves in the middle of the North Pacific. If you look at the corresponding surface analysis, you're almost certain to see a big low pressure system (or two) making the Aleutians quite unpleasant over the next few days.
The lines represent significant wave heights at the measured level (like isobars, but with wave heights). Expect them to change as you move from the center of the plot.
Like anything on this scale, these are general trends, not local specifics. You may see effects from currents, local wind variations, land formations, or islands impacting these predictions on the local wave direction and height.
Upper Air Charts
The large-scale movement and formation of pressure systems is driven by wind above the surface, where jet streams and cold, fast winds constantly blow and shift. The tool to look at these is the Upper Air, "500 Mb", or Constant Pressure Chart. Our atmosphere is not uniform, and you can easily see there are different winds at different altitudes by observing high cloud movement compared to local wind direction.
Instead of pressure numbers and lines on the isobars, the numbers on the 500 mb chart show the altitude, in decameters, of where the air pressure reads 500 mb of pressure. A decameter is 10 meters, so just add a zero to any number on this chart to see how high in meters the 500 mb readings can be found.
Meteorologists read this to see the amount of spin and direction in upper air systems, and how larger masses are moving and being driven.
Ice Limits, Cyclone Danger, and Satellite photos
If you're sailing at extreme latitudes, NOAA publishes charts of estimated ice field and iceberg danger areas. During hurricane season, they show risk areas for hurricanes and cyclones on a specific chart focused on just that data. And satellite photos of forecast areas show cloud cover and make spinning storm systems very apparent.
Commercial weather sites often have composite charts with much of this data available as overlays, where you can selectively add and remove detail that interests you.
Resources and Chart Keys
We've thrown a ton of information at you in this article, and there's no way you'll remember it all. To help you, bookmark this article and refer to some keys we've linked to below. All the major weather providers have this information on their websites...somewhere!
Print out what you need for a quick reference, and look through each of these resources for more in-depth explanations of these topics.
NOAA Ocean Prediction Center - Terminology and Weather Symbols. An excellent decoding of chart symbols and abbreviations, with explanations of basic terms.
NOAA Graphical Products Legend (from the link above)
NWS Constant Pressure Charts - an overview of how to read a 500 mb chart and how meteorologists use the data.
National Weather Service JETSTREAM - a completely free online weather school, where you can take a much deeper dive into everything we've talked about.
Did you find the answer to your specific question?
👍 0 👎 0
Leave a comment